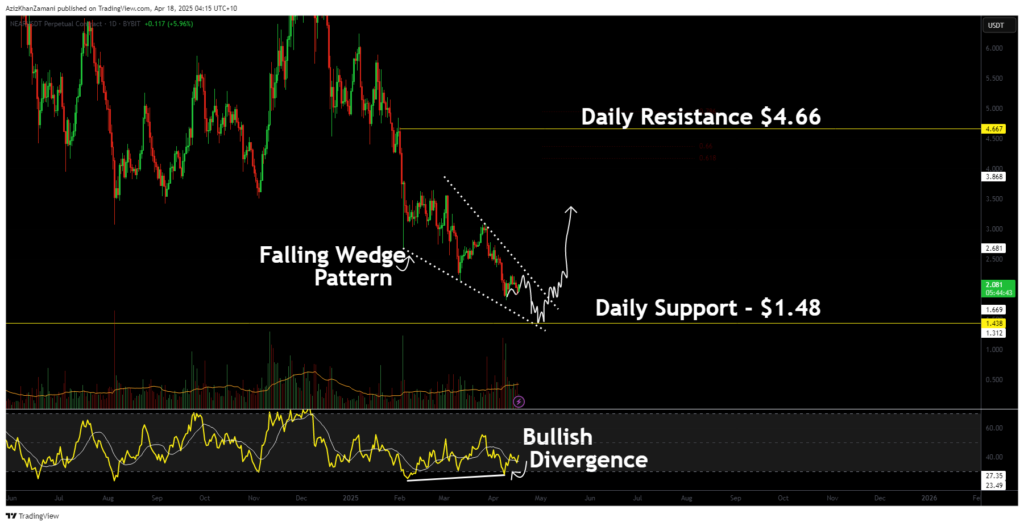
NEAR is showing signs of a potential bottom after weeks of aggressive selling. A falling wedge formation on the daily timeframe, combined with extreme oversold conditions and RSI divergence, points toward a possible bullish reversal targeting the $4.66 resistance zone.
NEAR (NEAR) has been in a steep and sustained downtrend, marked by heavy bearish expansions and cascading lower lows. However, recent price action is beginning to compress into a recognizable structure, a falling wedge, which often signals a shift in momentum. With key support levels approaching and momentum indicators flipping, NEAR may be preparing to transition from weakness into strength.

NEAR 的价格走势一直在挤压下降楔形,这是一种可靠的技术形态,通常以强劲的上行走势结束。收窄的区间表明抛售压力正在减缓,随着价格在楔形内收紧,突破的可能性更大。交易员通常将这些形态视为捕捉早期反转的机会,尤其是在成交量确认走势的情况下。
At the same time, NEAR’s daily RSI has entered deep oversold territory, historically a key signal for short- to mid-term bottoms. More importantly, RSI is printing higher lows even as price records new local lows. This bullish divergence is a sign that underlying momentum is shifting away from bears and often precedes sharp, impulsive reversals once structure breaks.
The $1.48 level remains a crucial support zone and has yet to be fully tapped. If price tests and holds this level while remaining inside the wedge, it could serve as the springboard for a breakout. On the flip side, a clean breakout with volume confirmation could propel NEAR toward the next major resistance at $4.66—an area that aligns with previous structure and fills inefficiencies left behind during the prior sell-off.
如果 NEAR 守住 1.48 美元支撑位或从该支撑位反弹,并坚定突破楔形阻力位,则可能引发看涨走势,并向 4.66 美元目标价位迈进。然而,如果未能守住支撑位,则可能推迟上涨。无论如何,该形态表明 NEAR 正进入一个可能出现重大逆转的高潜力区域。